Reporting & Analytics in Field Service: How It Works & What to Look For
What Is Reporting & Analytics in Field Service?
Field service reporting shows you what has happened in your business. This could be jobs completed, revenue generated, money received and callback figures.
Field service analytics shows you why these figures have changed and what you should do.
This can be broken down into:
- Report: “We had 36 repeat visits last month.”
- Analysis: “Most repeat visits were parts shortages on the same three trucks.”
- Action: “Restock those parts and update the van checklist.”
There are a few terms that are commonly used.
- KPI: A figure that helps to measure how well you’re doing against a particular goal. For example, first time fix rate.
- Dashboard: A screen displaying multiple KPIs.
- Drill down: Clicking on a figure to see the underlying jobs.
- Denominator: The group of jobs that a percentage is based on.
This term is more important than most owners realise and will be discussed later.
Where can you find reporting in your software stack?
Reporting is only as good as the data it pulls from. This will be in your FSM software, accounting system and sometimes your CRM or ERP.
If your technicians are failing to close jobs then your reporting will be inaccurate. If you have invoices sitting in draft then your revenue figures will look low.
This is something that software vendors will also mention. ServiceTitan have mentioned that “Revenue and performance-based compensation figures will only be visible in reporting when invoices are in a posted or exported state.” (ServiceTitan reporting documentation)
Why Reporting & Analytics Matter ?
Even if your business is busy, there may be issues impacting your profits including repeat call outs, unrecorded parts, overtime and uncollected invoices.
Reporting and analytics can help you understand how you are spending your time and money, identify any issues within your business and help you make decisions based on real data.
Why are they important?
Managing Labour Costs and Technician Productivity
Labour is a key consideration for Service businesses. Heating, air conditioning and refrigeration mechanics and installers are expected to grow by 11% between 2025 and 2035 – faster than average for all occupations.
With reporting, you can see how productive your technicians are by identifying how much time they are spending on productive work, travel time, overtime and completed jobs. For example, if they aren’t completing as many jobs it may be because they are working on more complex repairs.
Identify Jobs That Are Making You Money But Not Profits
Revenue is not the same thing as profit.
By looking at your profitability reports you can see how profitable your jobs are by comparing your invoiced revenue with your direct labour, materials, subcontractor and any other costs assigned to the job.
For example, if you have a $1000 repair job but your direct costs are $750 then your gross margin for that job would be 25%. This does not include any operational costs.
If you do not have accurate costing in place you may be continuing to offer services that look like they are doing well but aren’t bringing in as much profit as you would expect.
Minimise Repeat Call Outs and Waste
Repeat call outs can take away from your technicians’ time.
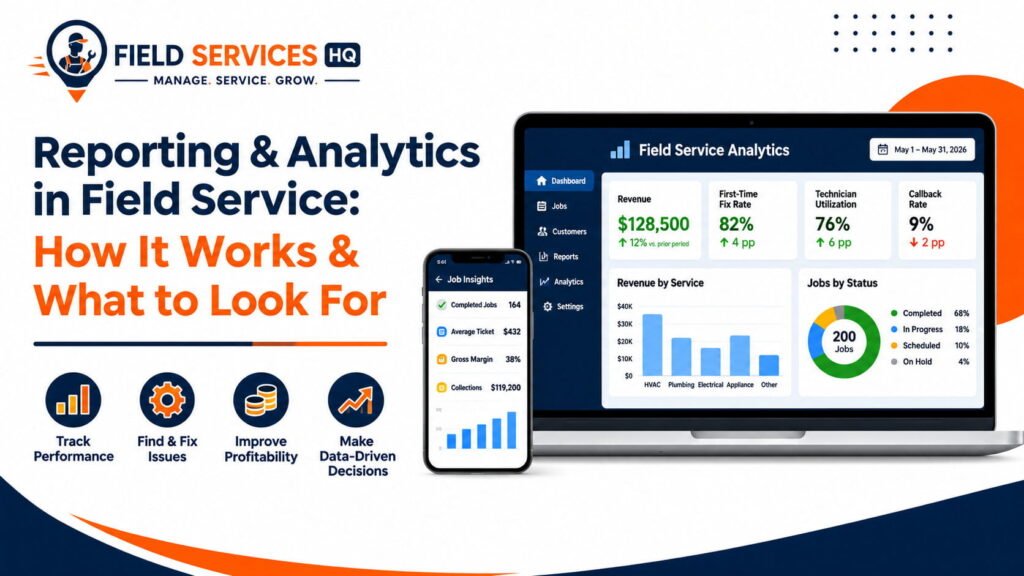
If you complete 200 eligible jobs in a month but only successfully complete 164 on the first call out then your first time fix rate is 82%.
By using reporting you can see why the remaining 36 jobs were not completed. Were they due to parts being unavailable, incomplete diagnosis, issues accessing the job or something else.
This is just an example and is not an industry standard. However, by knowing why your jobs are not being completed you can improve your operations.
Improve Your Cashflow and Planning
Completed vs collected.
Housecall Pro has documented KPIs to show the difference between completed revenue and collected payments. This can help you understand why you may be completing a lot of work but not collecting payments.
By looking at completed revenue, collected payments and ageing accounts receivable you can see where you are having issues with payments. This can help you chase up any outstanding invoices and plan your spend more carefully.
Help You Make Better Decisions As Your Business Grows
Reporting can be extremely helpful when you need to manage more jobs.
43.9% of businesses with 20-99 employees said they expected to have issues with finding skilled staff in Q2 2026 compared to 21.4% of businesses with 1-19 employees. These statistics relate to Canadian businesses across all industries.
With accurate reporting you can identify which technicians are overworked, any regular bottlenecks and which services require more labour. This can help you decide whether to improve your scheduling, change processes, provide training or employ more staff.
Overall, reporting will help you understand what is going on within your business. Analytics will help you understand why. While they won’t guarantee you will see increased profits, they will help your field service business have a better foundation to manage your costs, improve your service quality and plan for growth.
How Does Field Service Reporting & Analytics Work?
The process of reporting can follow the following steps no matter if you are using a basic app or ERP.
- Capture – Techs and the office record jobs, time, parts, notes and payments.
- Sync – Data flows between scheduling, invoicing, inventory and accounting.
- Calculate – The software uses formulas, filters and date rules.
- Visualise – Data is shown in reports and dashboards.
- Action – Price, schedule, training and stock levels are changed.
1 & 2 – Garbage In, Garbage Out
Most of the time poor data will be coming from the field. Maybe your techs aren’t recording parts or they are closing the job before payment is received.
Before investing in a nice dashboard it would be a good idea to fix this.
A simple way is to decide what 3 fields must be filled in.
- Type of job/Service
- Parts/Materials
- Time arrived and completed
3 – Definition issues
This can be an issue where 2 systems have revenue but mean different things. One could be revenue from completed jobs. Another could be cash received.
A great example of this is the KPI documentation within Housecall Pro. Completed Revenue is defined as the revenue earned from completed jobs. This doesn’t include cancelled jobs or refunds. Payments received is tracked separately and includes any partial payments received for outstanding invoices (Housecall Pro KPI Dashboard).
Whilst both are useful they are answering different questions.
4 & 5 – Dashboards
A dashboard isn’t a decision but can be valuable if each number has an owner.
Ensure each KPI has an owner and a day to be reviewed otherwise your dashboard will be a wall of text.
What Are The Most Important Field Service KPIs?
Short answer – start with 8, First Time Fix Rate, Technician Utilisation, Average Ticket, Estimate Approval Rate, Gross Margin Per Job, Callback Rate, Receivables Aging and On Time Arrival.
These will cover quality, productivity, sales, profitability and cash. This should be enough for most small service businesses.
| KPI | Simple definition | Decision it supports |
|---|---|---|
| First-time fix rate | First-visit resolutions / eligible completed jobs | Investigate repeat visits |
| Technician utilization | Productive hours / defined available hours | Capacity and scheduling |
| Average ticket | Eligible completed-job revenue / completed jobs | Revenue per job |
| Estimate approval rate | Approved estimates / eligible sent estimates | Sales and pricing |
| Job gross margin | (Revenue minus direct costs) / revenue | Job profitability |
| Callback rate | Jobs with qualifying callbacks / eligible jobs | Service quality |
| Receivables aging | Unpaid balances grouped by age | Collections |
| On-time arrival | Visits inside the promised window / eligible visits | Customer reliability |
KPI Definitions Checklist
Before you can benchmark, you need to define what each KPI means. Ask yourself:
- What is the numerator? What are you counting?
- What is the denominator? What jobs count?
- When does the job count? Date of job, date of invoice or date of payment?
- Are any jobs excluded? Cancellations, warranty work or free quotes?
- What data source? What system and field?
Within each of the above you need to define what counts. For example how long is a callback? Is it 7, 30 days or just same issue? What counts as a productive hour for your techs?
If you skip this step your data will contradict each other.
Example – First Time Fix Rate
If you have 200 eligible jobs to complete in a month and 164 were fixed on first visit.
164 divided by 200 = 82%. This is just an example.
It’s not the actual number that matters, it’s the other 36.
Break these down and categorise why.
- Parts not on truck
- Incomplete diagnosis
- No access to equipment
- Customer approval delay
If 20 of these 36 were due to parts shortages then you know there is an issue with stock, not techs. This will change who you coach and what you purchase. However, real data may tell a different story so be sure to check the data. An area to start could be improving field service stock tracking.
Examples of trades to track
HVAC – Track your call back rate on installations and servicing. Call backs with extra parts will eat into your margin.
Plumbing – Track your average ticket by type of call. You may have a lot of big drain specials but no extra sales.
Electrical – Track your approval rate of estimates for panel upgrades separately to small service calls. They are completely different businesses.
Benchmarking
Be careful with good numbers you see online. Companies can define metrics differently.
Start by benchmarking against your own previous months and only compare to others if the definitions match.
What features should you Look For in reporting & analytics?
Look For ready-made reports, filters, drill down to individual jobs, dashboards, exporting and clean integration to your accounting and inventory.
Feature lists will be similar but they need to work with your actual jobs.
| Feature | Why it matters | What to test |
|---|---|---|
| Prebuilt report templates | Saves setup time | Do they match your trade and job types? |
| Custom reports and metrics | Your business is not generic | Can you build one without a consultant? |
| Filters (date, tech, unit, service) | Finds patterns fast | Can you combine three filters at once? |
| Drill-down to records | Proves the number is right | Click a total and see every job behind it |
| Role-based dashboards | Owner, dispatcher, and tech need different views | Can you limit who sees margins and pay? |
| Exports (CSV, Excel) | Lets your accountant reconcile | Does the export match your invoices? |
| Scheduled reports | Delivers numbers without logging in | Can it email weekly on a set day? |
| Accounting and inventory integration | Keeps costs and payments aligned | What syncs, and how often? |
Role based dashboards
The dashboards will likely be different for different roles. ServiceTitan have role based dashboards for dispatchers , controllers.
This can work with smaller teams.
- Owner – Margin, Cash, Approval Rate
- Dispatcher – Jobs Outstanding, Capacity, Arrival Times
- Technician – Completed Jobs, Callbacks
- Bookkeeper – Invoices, Payments, Ageing
Limitations
Often features will be limited to your subscription. ServiceTitan mention that custom reports and dashboards depend on the package you are using.
Housecall Pro have a clear example of this. The mechanical KPI dashboard is only applicable to HVAC, Plumbing and Electrical businesses. The Tech Leaderboard requires an Essentials or MAX plan (Housecall Pro Tech Leaderboard).
Ask early – “Is this included in the plan you are quoting me?”
Integrations
Although this may sound simple, integrating your scheduling, invoicing, payments and accounting can be tricky.
You can run into issues like:
- Duplicate customer details.
- Data not syncing in a timely manner, meaning you won’t have accurate data for today.
- Costs for jobs never being passed into your accounting.
- Partial payments being recorded differently.
If you are looking at using an ERP/CRM with your FSM software ask for the rules around the integration. If you are using an open source option, like ERPNext, you will need to factor in the time it takes to set up and customise.
How Can You Use Reporting to Improve Business Performance?
Pick a problem, find the report, look at the data, make one change and measure after a month.
Don’t try to fix everything. A single focused change is better than 10 vague changes.
A simple review cadence
This cadence is editorial guidance, not a universal standard. Adjust it to your size.
Three decisions you can make using reporting
1. Reduce callbacks
Pull all your callbacks for the month and group them by technology, equipment type and cause. Check the cost of parts for each.
2. Ensure margin on jobs
Compare your quoted cost to actual cost for your top 10 jobs. If you are continuing to overspend on materials then update your price book. This will often lead to improved estimating and quoting processes in the field service.
3. Improve scheduling
Look at your technician utilisation and drive time. Large gaps between jobs often indicate the issue is with routing. See our field service scheduling guide to see what to do next.
How Do You Choose the Right Field Service Reporting Software?
Choose an application that suits your size and reporting needs. Try a real time demo with your ‘real life’ examples. What’s included in your package? How does the data sync? Can you report back to invoices?
| Stage | Reporting focus | Next step |
|---|---|---|
| Beginner | Jobs, revenue, payments, callbacks | Build a weekly scorecard |
| Growing | Tech output, estimates, utilization | Segment by team and service category |
| Advanced | Job margin, retention, asset trends | Audit data quality, then evaluate deeper analytics |
Frequently Asked Questions
What is reporting and analytics in field service management?
It is the process of turning job, technician, estimate, and payment data into reports and insights. Reporting shows what happened. Analytics helps explain why and what to change. Both depend on accurate records from the field and the office.
What is the difference between reporting and analytics?
Reporting summarizes past results. Analytics looks for causes, patterns, and next steps.
For example, a report shows 36 repeat visits. Analytics shows most were parts shortages on the same trucks.
What are the most important field service KPIs?
Start with eight: first-time fix, technician utilization, average ticket, estimate approval, job gross margin, callback rate, receivables aging, and on-time arrival. Together they cover quality, productivity, sales, profit, and cash. Define each one in writing first.
How do you measure technician productivity accurately?
Measure productive hours against clearly defined available hours. Then pair that with job mix, drive time, and callbacks.
Never judge a tech on revenue alone. A tech who gets the hard calls may look slower but be more valuable.
What is a good first-time fix rate?
There is no single universal number. It depends on your trade, how you define “eligible” jobs, and your service mix.
Track your own rate over time. Then study the jobs that failed the first visit.
Can field service software track job profitability?
Many platforms can, but it depends on the product and plan. Job profitability needs labor, parts, and other costs tied to each job.
ServiceTitan, for example, notes that some financial reports need job costing enabled. Ask for a demo with your own job.
What should a field service dashboard include?
Include a few numbers per role. Owners need margin, cash, and approval rate. Dispatchers need open jobs, capacity, and arrival times.
Add filters for date, tech, and service type. Keep it short enough to read in two minutes.
Can reporting integrate with accounting software?
Often yes, though depth varies. Ask what syncs: invoices, payments, customers, or job costs.
Also ask how often it syncs and how partial payments are handled. Then reconcile an export against your books.
How often should a field service company review KPIs?
A common approach is daily for dispatch, weekly for team performance, and monthly for margin and cash. This is guidance, not a standard.
Smaller shops can combine weekly and monthly reviews at first.
What should I look for in reporting software?
Look for prebuilt reports, custom filters, drill-down, role-based dashboards, exports, and clean accounting links. Confirm what your plan includes.
Then run the live-demo test with your own jobs before you sign.